The Economic Impact Of Hosting The 2026 World Cup In North America
Most economic assessments of hosting the 2026 World Cup in North America identify sizable benefits and notable risks: short-term job creation and tourism revenue plus accelerated infrastructure investment can stimulate regional growth and cross-border trade, while cost overruns, displaced communities, and legacy debt pose significant fiscal and social dangers; effective planning, transparent contracting, and targeted legacy use determine whether gains outweigh long-term liabilities.
Overview of the 2026 World Cup
Event Structure and Format
Expanded to 48 teams, the tournament uses 16 groups of three with the top two advancing to a 32-team knockout, producing 104 matches between June and July 2026. Multiple venues will host staggered kickoff windows to balance TV markets, while compressed group schedules increase fixture density and demand for rapid stadium turnaround and team logistics.
Participating Countries and Cities
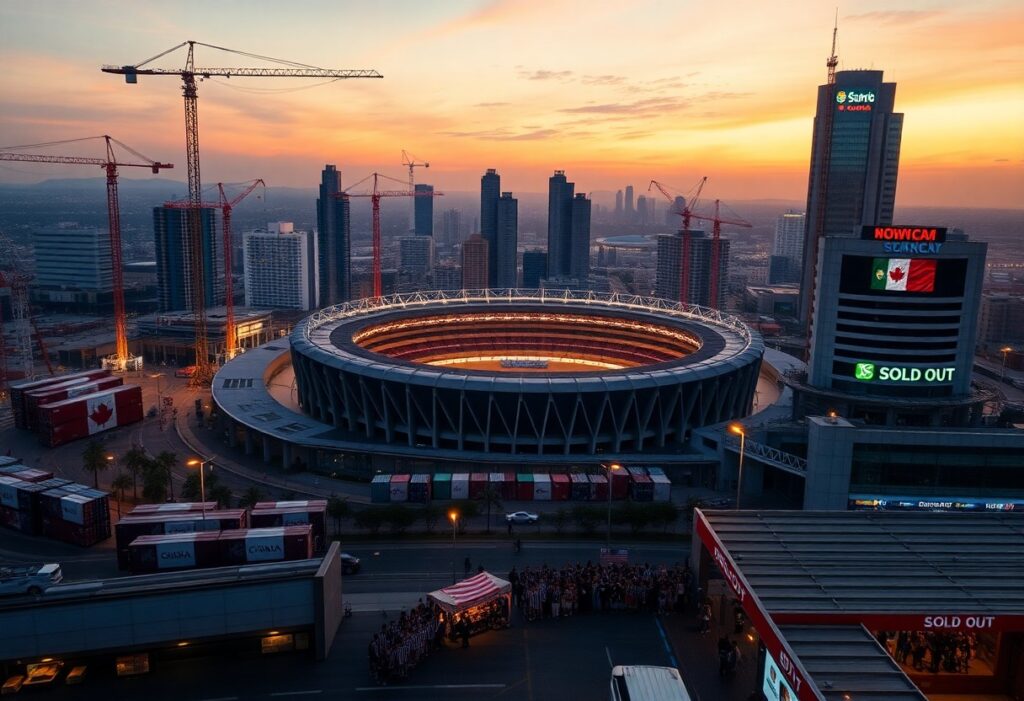
Hosts span 16 cities: 11 in the United States, 3 in Mexico and 2 in Canada, with flagship venues like MetLife, SoFi and Estadio Azteca anchoring the schedule. This binational layout amplifies broadcast reach and tourism flows, but also requires cross-border regulatory coordination among FIFA and three national federations.
Stadium capacities will vary from roughly 30,000 to over 80,000, driving uneven local economic impact; fan travel can cover thousands of kilometers between matches and border-crossing and visa logistics present operational friction that organizers must mitigate through coordinated transport, accreditation and entry policies.
Economic Benefits for Host Cities
Major host cities often record immediate spikes in visitor spending and public revenue: during match periods hotel occupancy can rise by 20-40%, restaurants and retail report surges, and municipal tax receipts can climb by $100-$500 million in large markets. Several host bids tie these gains to targeted transit and public-space upgrades that, if managed well, convert event-driven demand into sustained long‑term tourism growth.
Increased Tourism and Hospitality Revenue
Matchday demand typically pushes hotel rates higher and boosts ancillary services; estimates suggest major venues could see hundreds of thousands of additional visitors across the tournament, with average per-visitor spending of roughly $150-$300 per day. Cities that coordinate booking platforms, fan zones, and cultural programming-examples include coordinated city passes used in past tournaments-capture a larger share of that tourism premium.
Job Creation and Economic Growth
Hosting generates immediate hiring in construction, hospitality, security, and transportation, often adding tens of thousands of temporary positions in metropolitan areas; the net long-term employment impact depends on how many roles are converted to permanent work and whether infrastructure investments improve productivity rather than becoming costly, underused assets.
Past tournaments show most event-related jobs are short-term, so cities that invest in training and local procurement can increase conversion rates. For instance, targeted apprenticeship programs and supplier diversity requirements raise the share of lasting jobs, while unchecked capital overruns and displacement risks can negate gains-making workforce transition plans and contract transparency vital to translate temporary hiring into sustained economic growth.
Infrastructure Development
Host cities are sequencing investments to meet FIFA standards and peak visitor flows, blending stadium work with airport, rail and street upgrades. Many plans prioritize digital ticketing, security screening and broadcast infrastructure while balancing timelines ahead of summer 2026. Expected outcomes include short-term construction jobs and longer-term urban renewal, but projects also carry significant budget and schedule risk if scope expands or local funding shortfalls emerge.
Stadium Renovations and Construction
Renovations target sightlines, seating, media facilities and hospitality suites: examples include upgrades at Estadio Azteca (≈87,500), MetLife (≈82,500) and AT&T Stadium (≈80,000, expandable). Smaller venues like BMO Field (≈30,000) have pursued capacity and turf improvements. Work often runs into the hundreds of millions per venue, creating local jobs and tourism gains while posing white‑elephant and legacy-use challenges if post‑Cup demand is overestimated.
Transportation and Urban Development
Transport projects combine airport terminal improvements, expanded commuter rail frequencies, dedicated bus and shuttle lanes, and station accessibility upgrades to move millions during match windows. Cities typically plan surge capacity plus permanent benefits for residents; funding ranges from hundreds of millions to several billion dollars depending on scope. That investment can relieve chronic congestion but also imposes ongoing maintenance obligations on host municipalities.
Past events show the playbook: London 2012 accelerated station upgrades and Brazil 2014 pushed metro extensions, and North American hosts are following suit with targeted pieces-temporary park-and-rides, wayfinding tech, and modal integration pilots. Operational planning will stress coordination across transit agencies, airlines and police to manage peak days; successful execution yields lasting ridership gains, while poor coordination risks severe delays and reputational damage.
Potential Challenges and Risks
Hosting the 2026 Cup exposes cities to large budgetary risks, uneven regional gains, security demands, and environmental strain; previous tournaments cost host nations roughly $4-$14 billion (South Africa 2010, Brazil 2014, Russia 2018), showing how quickly overruns can erode projected benefits. Local governments may shoulder long-term debt while promised tourism and job booms concentrate around match cities, leaving peripheral areas with limited legacy value and heightened social tensions.
Financial Investment vs. Expected Returns
Municipalities must weigh stadium upgrades and transport improvements-often running into hundreds of millions per city-against uncertain ticket, tourism, and broadcast windfalls; some analyses of past Cups show short-term GDP spikes but weak sustained growth. With many U.S. venues already suitable, costs may be lower, yet firewalling taxpayers from cost overruns and ensuring binding legacy plans are vital to improve ROI.
Social and Environmental Impacts
Event-driven construction can trigger displacement, housing shortages, and strained public services, while mass air and ground travel produces a significant carbon footprint; marginalized neighborhoods often bear the brunt of security measures and gentrification pressures if mitigation is not enforced. Community inclusion and transparent compensation are pivotal to reduce social harm.
Specifically, forced relocations around stadium sites-well-documented after major events-erode public trust and can cost cities in legal and social liabilities, as seen in protests during past tournaments. Transportation surges can add millions of tonnes of CO2 unless organizers mandate low-emission options; FIFA’s sustainability guidelines and host-city pledges provide frameworks, but effective mitigation requires binding local policies: expanding public transit capacity, converting temporary venues into affordable housing or community facilities, imposing strict procurement standards for construction, and funding long-term maintenance to prevent “white elephant” outcomes. Prioritizing these measures turns short-term spectacle into lasting public value.
Comparative Analysis of Previous World Cups
Comparative Snapshot
| Host & Year | Economic Note |
|---|---|
| United States, 1994 | Commercial model drove strong TV and sponsorship revenue; attendance ~3.6M and legacy venue reuse boosted long-term returns. |
| South Africa, 2010 | Estimated $3.6B in stadium/infrastructure spending, short-term tourism lift but muted long-term GDP gains in many regions. |
| Brazil, 2014 | Public spending estimated at $11.2B; created white‑elephant stadiums and sparked major protests over social priorities. |
| Russia, 2018 | Large transport and stadium investments (est. $11B) delivered improved connectivity and a temporary tourism spike. |
Economic Outcomes from Past Events
Across editions, pattern emerges: major tournaments generate sizeable short-term inflows from ticketing, hospitality and TV-1994 saw ~3.6M attendees-yet long-term growth depends on legacy use and cost control. Brazil’s 2014 $11.2B public outlay illustrates how high capital spending can negate benefits, while Russia and South Africa showed infrastructure gains but limited sustained GDP uplift beyond construction and event windows.
Lessons Learned for 2026
Hosts that prioritized existing venues and regional distribution kept capex down and improved returns; 1994’s commercial model and venue reuse contrast with Brazil’s costly new builds. For 2026, using existing stadiums across North America-and binding legacy plans-can maximize tourism and media revenue while minimizing the risk of underused assets and public backlash.
More specifically, the 2026 tournament’s plan to use 16 host cities across the U.S., Mexico and Canada reduces the need for new construction, lowers per‑city risk and enables scalable transport upgrades. Addressing the most dangerous exposures-cost overruns, displaced communities and non‑performing stadiums-requires contractual legacy commitments, targeted public‑private financing and measurable post‑event use metrics tied to funding disbursements.
Long-term Economic Implications
Hosting 2026 with 48 teams and 104 matches across 21 host cities spreads economic effects regionally, favoring renovations over new arenas and shifting capital toward transit, hotels, and workforce development. Municipalities that lock in legacy uses for upgraded venues and invest in hospitality training stand to convert short-term visitor spikes into sustained tourism and business growth, while weak planning risks higher operating costs and missed opportunities for export-oriented clusters.
Post-Event Economic Sustainability
Cities must plan adaptive reuse to avoid white elephants, turning temporary facilities into community sports hubs, convention spaces, or mixed-use assets. Historical contrasts matter: 1994 U.S. hosting helped trigger MLS in 1996 and expanded youth soccer infrastructure, whereas some Brazil 2014 venues experienced low utilization. Robust public-private agreements, realistic demand forecasts, and phased debt repayment structures reduce long-term fiscal exposure.
Impact on International Image and Investment
Global visibility can catalyze inbound investment if paired with a clear value proposition; the tournament’s finals routinely reach over 1 billion viewers, offering unmatched branding for cities and regions. Targeted post-event trade missions, tourism campaigns, and regulatory signaling (tax incentives, streamlined permitting) convert media attention into measurable FDI and convention wins.
North American hosts have concrete precedents to emulate: Mexico’s 1970 and 1986 tournaments spurred sustained tourism in key cities, and the 1994 U.S. World Cup helped create professional leagues and broaden the fanbase. With 21 host cities, coordinated regional strategies-joint marketing, aligned incentive packages, and KPIs tracking hotel occupancy, business registrations, and FDI leads-will determine whether the event produces a lasting uplift or only a transient economic spike.
Final Words
Considering all points, hosting the 2026 World Cup in North America will generate significant short-term revenue through tourism, employment, and infrastructure investment while offering long-term returns if legacy planning, equitable economic distribution, and fiscal oversight are enforced; coordinated regional strategies can maximize benefits, mitigate costs, and leave durable urban improvements that strengthen local economies and international sporting stature.
FAQ
Q: What short-term economic effects can host cities expect from the 2026 World Cup?
A: Host cities typically see a concentrated surge in activity: construction and stadium refurbishment create temporary jobs and procurement contracts; hotels, restaurants, retail and local transport experience higher demand from fans, teams and media, increasing sales taxes and occupancy rates; and event-related spending by visitors generates multiplier effects in the local economy. That boost is often uneven across neighborhoods and concentrated around match venues and fan zones. Short-term benefits can be partly offset by higher prices, crowding that displaces regular tourists, and businesses that see only limited net gains if local residents avoid downtown areas during matches.
Q: What are the likely long-term economic impacts and major risks for host regions?
A: Long-term outcomes depend on planning and legacy use. Positive impacts can include improved transport links, upgraded public spaces, increased global visibility that supports future tourism and business events, and urban regeneration in targeted districts. Key risks are cost overruns, underused facilities (so-called “white elephant” stadiums), ongoing maintenance burdens, and public debt that strains municipal budgets. There can also be negative social effects such as displacement, rising property costs, and opportunity costs when public funds are diverted from schools, healthcare or regular infrastructure. Empirical studies of past mega-events show mixed results; benefits accrue when host cities embed investments in broader, sustainable development plans and secure multiuse, revenue-generating post-event uses for major assets.
Q: How will public financing choices affect taxpayers and what measures can limit fiscal exposure?
A: Public financing methods-direct budget allocations, municipal bonds, tax-increment financing, sales-tax increases, and public-private partnerships-determine who bears risk and how costs are repaid. Heavy reliance on taxpayer funding or long-term debt can leave local governments exposed to cost overruns and lower-than-expected revenues, potentially forcing service cuts or tax hikes. Mitigation measures include rigorous cost-benefit analysis, conservative revenue projections, binding legacy-use agreements for venues, risk-sharing contracts with private partners, transparent procurement and reporting, and earmarking event revenues (ticket taxes, hospitality surcharges) to service debt. Structuring investments around multipurpose infrastructure and phased expenditures reduces the chance that facilities become fiscal liabilities after the tournament ends.